The past few months have seen cryptocurrency prices climbing to new highs with Bitcoin (BTC) exceeding and reaching a new peak of USD 42K and Ethereum (ETH) approaching its all-time high of USD 1.4K. What are the factors driving this swing in the markets?

Some economists have theorized that external factors such as the continuous monetary stimulus by the US government have led to people fleeing to assets which are better store of value such as gold or Bitcoin. Others have pointed out that a rise in institutional demand such as Paypal offering bitcoin payments have led to a spike in prices.
Prices have also fluctuated with regulatory news or celebrity endorsement. For instance, the SEC (Securities & Exchange Commision) lawsuit against Ripple (XRP) in December sent its price tumbling down 60%, before clawing back 20% as the situation cooled down amid the bullish run.
In the case of BTC, Elon Musk’s positive tweet resulted in a ~10% spike in BTC's price, while the Capitol Hill riots also possibly contributing to some market turbulence.


To what extent are Cryptocurrency prices being driven by institutional investors or retail traders? How has the distribution of wealth in the markets changed over time?
On-chain data complements existing sources such as exchange trading books to provide insights on the activities in the blockchain space. Leveraging our existing data store we highlight 3 metrics which investors or anyone interested in the virtual asset markets should keep track of.
Persistent Whales

In contrast to the price crash following an all time high in 2018, where there were signs of panic selling, BTC whales (defined as wallets with more than 1000 BTC) seem fairly optimistic about the future (at least at the time of this report) and are holding their coins. From the graph, there has been a steady uptrend of such wallets since January 2019. According to Bitinfocharts, these wallets currently hold close to 30% of the entire BTC market capitalization, a signal of strong institutional interest or perhaps greater acceptance among the wealthy of BTC as a store of value.

On the other hand, the ETH market seems to be less affected by whale accounts. Despite the 2018 price crash, the number of whale accounts continue to steadily increase. One possible explanation is that Ethereum’s primary use case is its smart contracts functionality, which large entities have been adopting over the past 3 years. For example, parts of Microsoft Azure, a cloud storage platform, is built on top of Ethereum.
Nevertheless, the number of ETH whale accounts have been decreasing steadily even as its price approaches a new high. This is not necessarily a negative trend, as ETH is typically regarded more for its utility than as a store of value. The growth in the decentralized finance (DeFi) movement has also given rise to plenty of alternative coins within the Ethereum blockchain which investors might choose to diversify to.
Moving average of the number of active addresses in a day
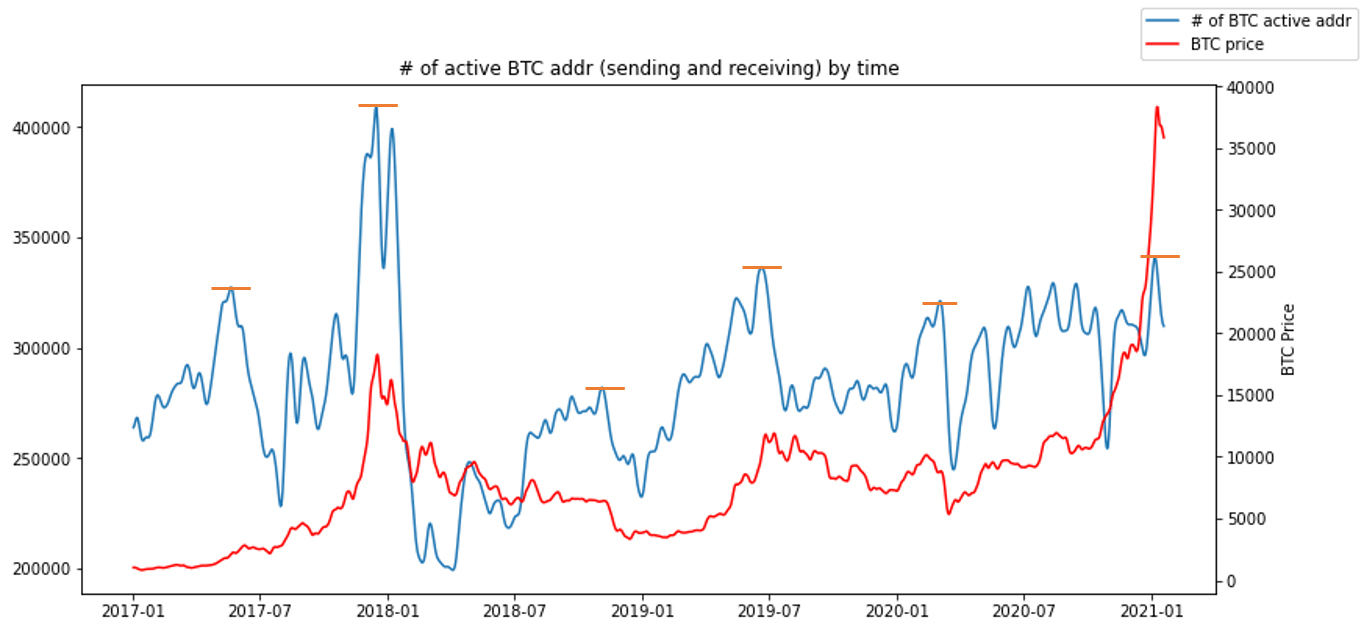
This metric helps shed light on retail trading interest. Using a moving average reduces noise from addresses & activities that might not be trading-related, such as mixer services. From the graph, the peak of the metric usually coincides with the short-term peak of BTC price.
The price crash in 2018 showed an all-time high peak activity followed by seasonal low activity. This is also seen during the first quarter of 2020 where the market ‘crashes’ temporarily due to covid fears. The higher the peak of this metric, the lower its subsequent trough, indicating that a significant amount of addresses have left the market or sold their coins.
Despite the recent spike in price, Bitcoin activity seems to be way below its 2018 peak.

For ETH, we excluded smart contract transactions to only focus on the activity of traders. Similar to BTC, ETH’s activity is at a relatively healthy level compared to the peak in 2018.
Gini Coefficient
The gini coefficient measures the dispersion of wealth within a community, ranging from 0 to 1 with 0 representing perfect equality. An economy with a more even distribution of wealth is thought to be more stable as it is unlikely for any group of individuals to move the market. BTC and ETH are the top 2 cryptocurrencies with the fairest wealth distribution - let's analyse how this trend has changed through the years.

The flattening out of the curve is a good sign of general retail interest and holding power of BTC. An interesting insight from the graph is that prior to the 2018 price crash, the gini coefficient started to gradually increase. This could be a sign that of traders selling their coins to centralised exchanges, shifting the concentration of wealth to these large entities. In the current bullish run, the coefficient started to rise a little but it is still early to tell whether the rise will be temporary or persistent.

Like BTC, ETH’s gini coefficient has been flattening out over the years. ETH is also shown to have a more uneven distribution of wealth than BTC, possibly due to their different models (UTXO for bitcoin vs wallet based for ethereum). Unlike BTC, it is difficult to tell how ETH price trends with its Gini coefficient (seems to be opposite of BTC’s signals).
Conclusion
We hope this article gives you a good sense of the power of on-chain data and how it can be used to analyse market activity and patterns. With full transparency of activities in the blockchain, Cylynx is able to pick up more localized patterns and behaviours such as trading activities between whales and exchanges. Contact us if you are looking for customized blockchain metrics and analysis for Bitcoin, Ethereum or popular ERC-20 tokens.
Enjoying the content?
Subscribe to get updates when a new post is published