Visualizing Supply Chain Networks with Motif
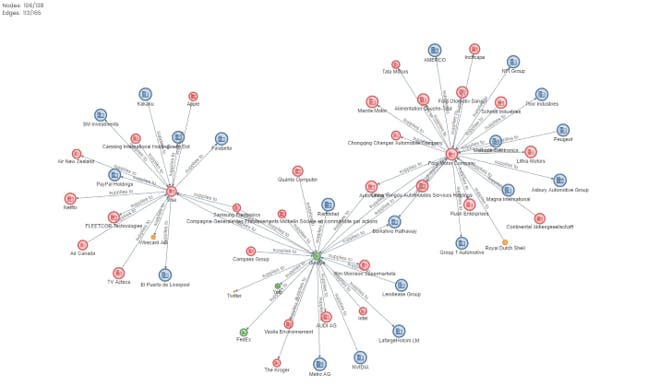
In this article, we show how a tool like Motif could be used to augment existing collected data and simplify the analysis of supply chains.
Cylynx
July 14, 2021 · 4 min read
In this article, we show how a tool like Motif could be used to augment existing collected data and simplify the analysis of supply chains.
Cylynx
July 14, 2021 · 4 min read
A supply chain describes the organizations, people and activities involved in supplying a product or service to the customer. With trends such as globalization and the rise of e-commerce, mapping and visualizing the supply chain network can give us insights into what these trends mean to us and how they impact us.
However, there are two main barriers to using supply chain data as part of a company’s decision-making process - data quality and skills shortage. On the data side, supply chains are getting more complex and obtaining key information about one’s suppliers and their suppliers is a tedious process. Supply chain managers are also unlikely to be experienced in data analysis and might be unable to fully make full use of analytics and the insights behind their supply chain data. Most companies also do not have procedures in place to explore, evaluate and analyze supply chain data.
In this article, we show how a tool like Motif, a no-code graph visualization platform, could be used to augment existing collected data and simplify the analysis of supply chains in a way that makes it accessible to business teams.

Supply chain networks allow us to look at the big picture; giving us a better understanding of the flow of resources and information. By visualizing the supply chain networks and mapping numerous variables, we can expose unexpected relationships between them and uncover hidden insights.
Analysing and visualizing the supply chain using data and quantitative methods can help to improve decision making across the supply chain. Beyond internal data held on Supply Chain Management (SCM) and Enterprise Resource Planning (ERP) systems, companies can also tap on external data sources such as news or credit scoring APIs. Combining multiple datasets with statistical analysis and data visualization can help companies keep track of risk factors and inefficiencies in their supply chain.
Financial institutions such as banks or insurance companies may also try to understand a customer's supply chain connections to conduct detailed Environmental, Social and Governance (ESG) or credit risk checks. This requires access to certain data and information to develop insights, which are then turned into actionable intelligence. However, manually searching and crawling such information takes up the time and energy of compliance teams, which can be used more efficiently on other more complex matters.
When making use of the right technology, this process can be made more effective and efficient. For example, using existing data APIs and network visualisation software can help reduce the time taken to uncover these hidden relationships and insights.

Motif is a no-code graph intelligence platform that helps analysts transform connected data into actionable insights. As supply chains are best represented and understood as a connected network of people, entities and activities, we can use Motif to accelerate the data discovery and analysis process.
Motif can easily get data from various data sources such as supply chain data providers, corporate registry data, corporate acquisition and exit actions, employee information, Google news and external APIs.
With its self-served web interface, risk and compliance officers can pull up detailed relationships of a given company to automate corporate onboarding checks more efficiently. Motif also offers automated Google news scraping and retrieval of content, further increasing the convenience and efficiency of visualizing the supply chain.
Apart from simply retrieving information, Motif is also able to classify and do risk scoring of news content. With this, users can browse through news content and get better sensing of supply chain risk factors. With these automation and risk scoring algorithms, Motif can help companies better visualize the supply chain and get to these insights much faster.

Source: Financial Times
Once we obtain a map of supply chain relations, we would probably want to augment and enrich it with other contextual information. This could include external news sources or specialized API sources.
By enriching our corporate relationship data with google news sources and automatic natural language processing (NLP) to detect key terms of interest, we can quickly create a credit or ESG risk scoring system. We use a simple Vader model to tag each article with an adverse news score and classify it based on the category which it is related to e.g. ESG related or credit related.
Users can do a real-time search of all related links and relationships from multiple data sources to create a company 360 view enriched with ESG or credit information of interest. With a graph structure, users are able to do a recursive search for all other relationships of interest (suppliers, subsidiaries etc.).
Other than the data sources that we have selected, we can also expand our data sources to include any custom data sources of your choice.
We can also use the actions and decisions taken on the Motif platform to train specialized NLP models on calibrated news sources to recognize ESG and credit risks. Apart from training these NLP models, we can also use human inputs or past screening decisions for better risk calibration.

In this article, we showed how Motif can extract supply chain information and visualize it quickly and effectively. While supply chain mapping and visualization can be a challenge for many, making use of software solutions such as Motif can make the uncovering of new insights more efficient and convenient.
If you are interested to learn more about using Motif in supply chain visualization, feel free to reach out to us on our contact form. Meanwhile, you can also explore a more general Motif Demo and our open-source Github repository.